Data-driven leadership reaches beyond the club’s finances. The most important club facet is the membership experience, and very few businesses
have as much insight on their customers as private clubs. There is significant room for advancement in data-driven insight that can flow from analyzing the connections between demographics, spending and usage habits, and member satisfaction. There are great insights to be found at the intersection of age, tenure, satisfaction and loyalty by studying the various generations using the Net Promoter Score (NPS) to gauge overall satisfaction and loyalty.
NPS was conceived in 2003 by Fred Reicheld, a consul- tant with Bain & Company. According to Bain’s website, “We created the Net Promoter SystemSM to help companies measure and manage customer loyalty.”
NPS groups customers into one of three buckets based on whether the customer would recommend the given business (in this case, a club) to a friend or family member. The score,
as originally conceived, is based on a scale of zero to 10, with zero indicating no possibility of recommendation and 10 indicating an active and enthusiastic promoter:
- Scores of nine or 10 are considered “Promoters.”
- Scores of seven and eight are considered “Passives.”
- Scores of zero to six are considered “Detractors.”
| Number of Customers Surveyed | 253 | |
| Number answering 9 or 10 | 54 | 21% |
| Number answering 7 or 8 | 23 | 9% |
| Number answering 0 – 6 | 176 | 70% |
NPS is calculated by subtracting the percentage of Detractors from the percentage of Promoters; scores can range from -100 to +100. In the example above, the NPS is -49% (21% – 70%). In the end, the % sign is dropped. As you have probably surmised, an NPS of – 49 would be very bad news for any business owner.
Club Benchmarking (CB) calculated NPS from nearly 56,000 members of 71 individual clubs. The resulting NPS data is summarized in the table below.
| Number of Members Surveyed | 55,753 |
| Median NPS (71 clubs) | 48 |
| Lowest NPS (of the 71 clubs) | -15.6 |
| Highest NPS (of the 71 clubs) | 88.2 |
For context, NPSs vary by industry. The graphic below shows the average NPS for various industries according to SATMetrix, a leading global provider of customer experience management software. Their research cites the average NPS across 200,000 companies at 32. Within that context, clubs tend to perform on the higher end of the spectrum.
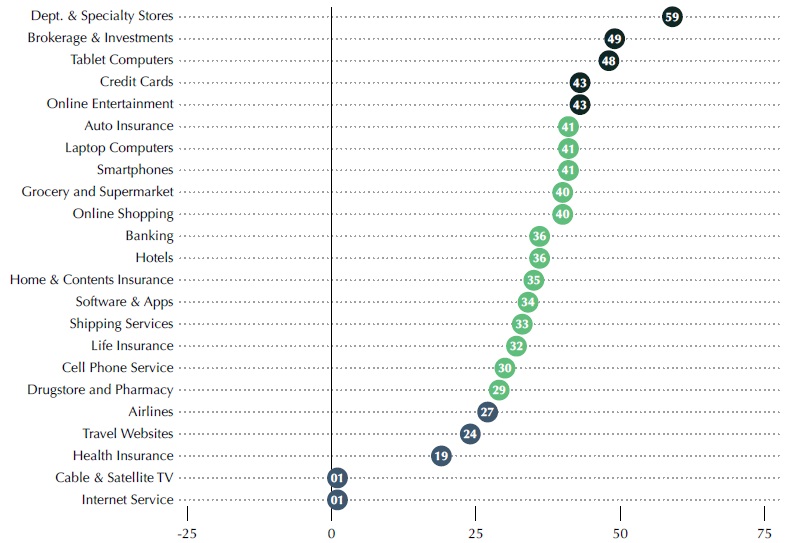
** Average NPS by industry according to SATMetrix
For additional context, according to Forbes, the average NPS for hospitality (including travel and restaurants) is 53. The median NPS in the club industry is 48; just below the Forbes hospitality average.
Within the data collected from nearly 56,000 club members, 40,895 responses included the member’s tenure and age. The following analyzes the generational aspects of those responses to determine whether age or membership tenure affect the NPS. The graph below shows the distribution of the surveyed members by age. The Y-axis is the percent of respondents, and the X-axis is the age. For instance, 3% of the respondents were 65.
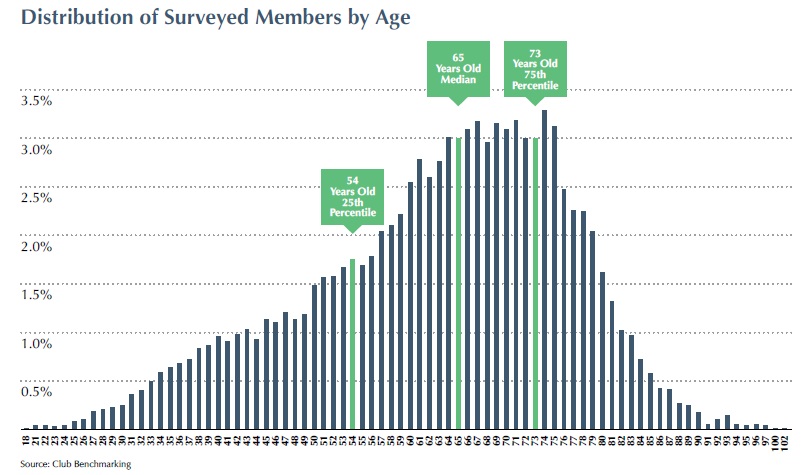
The median age of members surveyed is 65 and the average age is 63—higher than the industry average age of 58 because the mix of surveyed clubs included a higher concentration of residential community clubs in retirement zones. Throughout the industry, about 18% of clubs are residential community clubs in retirement zones (Florida, Arizona, etc.); 32% of clubs in this analysis fall into that category. The population of members is presented in relation to generations in the table below.
Surveyed Members by Generation
| Generation | Birth Years | # of Respondents |
| Greatest Generation | 1925 or earlier | 35 |
| Silent Generation | 1926 – 1945 | 6,982 |
| Baby Boomers | 1946 – 1965 | 22,829 |
| Gen X | 1966 – 1980 | 7,901 |
| Millennials | 1981 – 1997 | 3,102 |
| Gen Z | 1998 or after | 46 |
| Total | 40,895 |
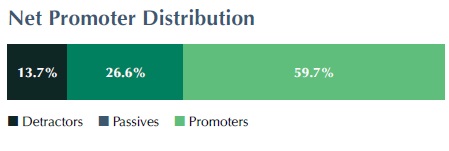
Overall, the NPS derived from the 40,895 respondents was 46 (59.7% Promoters – 13.7% Detractors = 46% NPS), as shown at right. That is just below CB’s median of 48 from all respondents (In some of CB’s surveys, the age and membership tenure were not gathered. That data was not included in this analysis.).
Digging deeper, the below table shows the distribution of NPS based on respondents’ membership tenure.
| Years of Tenure | % of Reponses | Average Rank (0-10 Scale) | Detractors | Passives | Promoters | NPS |
| 0 to 5 | 30% | 8.6 | 11.1% | 27.1% | 61.8% | 50.7 |
| 6 to 10 | 19% | 8.4 | 14.7% | 27.0% | 58.3% | 43.6 |
| 11 to 20 | 25% | 8.4 | 14.8% | 26.1% | 59.1% | 44.3 |
| 21 to 30 | 15% | 8.3 | 14.9% | 26.8% | 58.3% | 43.4 |
| 31 to 40 | 6% | 8.4 | 14.5% | 25.7% | 59.8% | 45.3 |
| Over 40 | 5% | 8.4 | 14.8% | 24.6% | 60.6% | 45.8 |
Club leaders should be cognizant of two clear patterns in these findings. The first is that newer members tend to view the experience more favorably than those with longer tenure, which is probably not a surprise. The NPS of 51 for members with tenure of five years or less is above the average of 46 for all respondents, meaning newer members are generally more enthusiastic and compelled by the experience. In the honeymoon phase, members are still very clear on why they joined the club and seem to believe they are getting what they hoped for from the experience.
Data also show the average age of the zero-to-five-year tenure group of respondents is 57, which is higher than the
industry average “new member” age of 42 in a standalone club and a bit younger than the average “new member” age of 60 in a residential community club. As previously cited, this sample includes a higher proportion of residential community clubs than the industry overall, which affects incoming member age. Observation also indicates that in the standalone clubs, the average age of members with zero to five years’ tenure being higher than an expected 42 may be a result of membership roster expansion during the pandemic. Surveys conducted for this research were completed during the pandemic and we believe the large influx of new members during that period had a wider-than-normal age distribution.
| Generation | % of Reponses | Average Rank (0-10 Scale) | Detractors | Passives | Promoters | NPS |
| Greatest | 0.1% | 9.2 | 8.6% | 0.0% | 91.4% | 82.8 |
| Silent | 17.1% | 8.6 | 11.8% | 22.7% | 65.4% | 53.6 |
| Boomers | 55.8% | 8.5 | 13.2% | 25.4% | 61.4% | 48.2 |
| Gen X | 19.3% | 8.2 | 15.7% | 31.3% | 53.0% | 37.3 |
| Millennials | 7.6% | 8.2 | 15.7% | 32.2% | 52.0% | 36.3 |
| Gen Z | 0.1% | 8.2 | 15.2% | 32.6% | 52.2% | 37.0 |
This second table presents a surprising pattern. There is a clear negative trend in NPS among younger generations of members. Gen X and millennials comprised 27% of respon- dents, and as a group, they had statistically significant lower NPS outcomes. The NPS shift occurred mostly because of a shift between Promoters and Passives—not a pronounced increase in Detractors. There is enough additional data in the satisfaction surveys for us to dig in and understand what is driving that shift, but that was not the focus of this analysis. That work will occur in the future.
We know from the more detailed satisfaction data gathered over time that younger generations desire a broad, compelling member experience. They simply want “more.”
One of the most delicate balances a club must strike as it formulates plans and vision for the future is that between status quo and evolution. Older members tend to be content with the way things are, while younger members want to invest in driving the member experience forward for the future. The key point of the analysis, however, is for each club to understand how the various societal generations manifest within their own club. Does membership survey data at your club reflect what has been learned from this analysis? Is there a gap between the needs, wants and expectations of younger
and older generations? How satisfied and loyal are your members relative to club industry norms? Club Benchmarking data shows a wide variation of NPS ranging from a club with an NPS of -16 to one with an NPS of +88. Do you understand where your club falls within that wide spectrum? Do you understand what is driving that NPS?
Relative to Forbes reporting on average NPSs in the hospitality sector, clubs need improvement, as they fall below the broader hospitality average NPS of 53. Member- ship surveys help club leadership teams understand their members’ perspectives on the club experience, which are central to their success. Every club must, by definition, cater to a broad array of generations and must therefore under- stand how satisfaction and loyalty vary across the member- ship in relation to members’ age and tenure.
One of the most critical aspects of planning in a club is laying out a forward-looking vision for the club’s facilities and campus. The path to success in that endeavor begins with a data-driven perspective on the make-up of the club’s membership. Balancing the needs, wants and expectations of younger and older members is a central aspect of strategic planning and effective planning for evolution of facilities through capital investment.