MANY CLUBS WORK WITH MORE THAN ONE SOFTWARE VENDOR OR SYSTEM. The accounting team usually has a system that is tailored specifically for clubs. Marketing and communications teams often work with a vendor that specializes in website design, digital marketing and member communications. Then there are systems that provide reservations at the club like dining, tee times, lessons and spa and event registration, which could be provided by a third or fourth vendor or by the accounting or website provider. Some clubs even use a different system to track and manage member complaints or to manage staff and for timekeeping.
Clubs may prefer a single vendor to provide all these solutions. Unfortunately, the reality is systems that work for one club department often do not meet the needs of another. Department managers should choose the tool or vendor that they think will best serve the members and the staff—and luckily in today’s connected world there are so many great choices. Because each club has a unique nature and differing programming and operating structures, finding the right solutions can get complicated. Clubs also add and adopt new systems—often at different points in time—resulting in a multiple system footprint. This can create a challenge for reporting and impede the ability for management and board members to get a good view of the club’s operations through a single lens. For example, a report listing members who play golf but do not dine as much at the club will need to pull data from accounting, dining reservations and tee time systems. Doing this without a true secondary warehouse results in a point-to-point model (See Figure 1: circles represent systems and arrows represent data pipes) that is complex and expensive. Having a warehouse like the hub and spoke model not only addresses the business needs but also keeps it simple.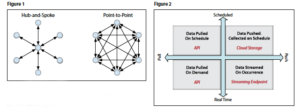
Interpreting Data
Running a club well requires a holistic view of the operations. Systems can be separated by department, but the lens for reporting needs to be simple and comprehensive. For the vast majority of private clubs, the most important view is that of their members. This means putting the member (or member category) at the center with information from multiple systems connecting to that. After all, a club’s membership is its greatest asset. Information sets should include member demographic data (gender, age, living distance from club), member spending (what did they spend, how often), member usage patterns (reservations, lessons, dining) and member communications (email read rates, website usage).
Often, to get this kind of comprehensive view today, someone at the club has to manually collect reports from different systems, clean up data and combine them in one report. This needs to be replicated, taking staff time and effort to create all of the reports regularly.
The good news is newer integration technologies can fetch data from different systems behind the scenes automatically. Data aggregated in a single place, also known as the hub-and-spoke model, helps keep a single version of accuracy.
Integration options can range from pulling data, collecting pushed data and streaming data. They include:
- “I will call you at scheduled time.”
- “Leave me a message. I will check for it at a scheduled time.”
- “I will call you as needed.”
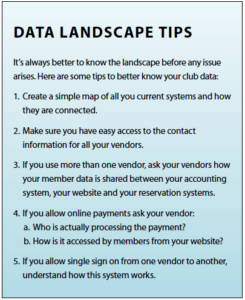
- “You call me as things happen on your end.” All of these options have a technology equivalent for integration. Integration patterns, reporting needs and system capabilities determine which of these make a better fit. Figure 2, offers an explanation of how data integration can work
Top left quadrant of Figure 2: Maps to “Will call at a scheduled time.”
Suitable for: Data that doesn’t need to be real-time or that doesn’t change during the day. Systems that are built to share data through an application programming interface (API).
Pattern: Warehouse makes a secure request at scheduled time (like 7 a.m. daily) to collect data. This is a very common integration pattern being used by clubs today.
Top right quadrant: Maps to “Leave a message. Will check for it at a schedule time.”
Suitable for: Data that doesn’t need to be real-time or that doesn’t change during the day. Systems that don’t currently support sharing data, but that can bundle a report and place it on a secure drop box or in the cloud.
Pattern: Warehouse will check drop box at scheduled time (like 7 a.m. daily) to collect report. This is the most common integration pattern for older legacy systems.
Bottom left quadrant: Maps to “Will call as needed.”
Suitable for: Reported data that needs to be updated during the day. Systems support API and there is a business case that benefits from getting real time data on demand.
Pattern: Warehouse will call API to deliver real time reports. This is less common, but very useful for special cases such as same-day cancellations by members.
Bottom right quadrant: Maps to “Call me as things happen on your end.”
Suitable for: Reported data that needs to be updated during the day. System has hooks to call API of another system.
Pattern: Rather than have a warehouse call system to construct real time reports, the system calls into API made available by warehouse for activity. Also less common, but reports provide the most current picture at any given time.
Data Warehouse
 Collected data can be parked in what is called a data lake—a repository where raw data is stored. Data rules clean the raw data and put them in a data warehouse that is optimized to provide reporting and analytics for the club to use to better make decisions.
Another advantage with a data warehouse is reporting does not place additional demand on the operational systems used everyday and allows staff to use existing systems just as they do today. The separate warehouse has curated data from different systems and can act as a hub for current and future gateways to other systems or can simply be used for effective reporting and dashboards with each user seeing only what they need to make better decisions.
Great operating dashboards bridge multiple systems at the club to provide a holistic view for reporting, measurement, and trending and predictive analytics. There is no better tool for management, committees and boards than objective data. It’s the truest guide for good decision-making.
Kevin Kopanon is president of MetricsFirst and Srikanth Parameswaran is director, R&D at MetricsFirst. They can be reached at [email protected].