The Club Technology study was conducted with support by Hospitality Financial and Technology Professionals (HFTP®). NCA members will receive the full report in April 2018. Learn more about HFTP at hftp.org.
Following a study in Spring 2017 on the state of club technology and timing of technology upgrades, this study concentrates on the criticality, value creation, usage, and performance of club information systems and their features. In other words, this study explores how clubs view technology in helping them to create value for their stakeholders. With the guidance of the Club Advisory Council of Hospitality Financial and Technology Professionals (HFTP®), this study was developed throughout the spring and summer of 2017 and distributed to club professionals starting in October, including members of the National Club Association (NCA). It stayed opened until December 27, 2017 to gather the opinions from club professionals.
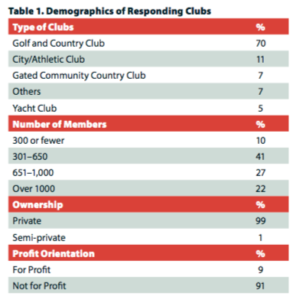
A total of 139 club executives participated in this study, with Florida (21%), California (9%), and New York (9%) being the top three states responding, closely followed by Illinois (7%) and Pennsylvania (6%). Golf and country clubs were the majority (70%), with social and golf-only clubs making up the “others” category. Regarding membership, most clubs were medium in size, with either 301 to 650 (41%) or 651 to 1,000 (27%) members. The vast majority (99%) were private clubs and not for profit (91%) (See Table 1).
The study had four major sections, one for each of the major systems used in clubs: Customer Relationship Management (CRM), Accounting, Website, and Security. These systems were also the most important ones to the accounting and technology professionals. For each of these four systems, four series of questions were asked: (1) the level of criticality of the features to the mission of the club, (2) how such features add value to the club, (3) how often were the features used by the clubs, and (4) whether the performance level of such features lived up to the expectations.
Customer Relationship Management (CRM)
The most used featured in CRM were listed alphabetically: Business Intelligence, Campaign Management, Dining Reservations, Event and Catering Management, Front Desk Management (clubs with guestrooms), Grab and Go (buy food at any location online or via phone), Marina Management, Membership Management, Point of Service (POS), Spa Management, and Tee Time Reservations. Clubs executives were first asked whether they had such features in their CRM systems, and then they were asked to rate how critical each feature was to the mission of their clubs.
Criticality. Club executives first gave their opinions as to the level of criticality of each of these features within the CRM system (See Table 2a). On a scale of 1 to 5 with 3 being the average, only two systems, Grab and Go (2.49) and Campaign Management (2.95) were rated below 3. POS received the highest rating of 4.89, indicating its significance in daily club operations. Although Membership Management ranked second (4.50), there were three systems that can be considered as tied for the third place as they were only 0.05 apart (Front Desk at 4.28, Tee Time at 4.26, and Event/Catering at 4.23).

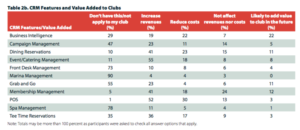
Adding Value. The opinions of whether 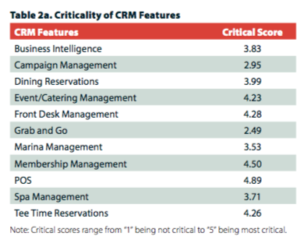 each feature would help clubs to increase revenues, reduce costs, have no effect right now on neither revenues or costs, and would likely add value to the club in the future were recorded. Participants were also asked to check all answers that were applicable. Table 2b summarize the results. As there were different types of clubs in this study, some features were not applicable (such as tee time reservations for a non-golf club) to all clubs. The POS feature within CRM was ranked the highest in both increasing revenues and reducing costs. Therefore, when considering a new system, special care needs to be placed on the POS feature as it has a very positive effect in value creation in clubs. In addition, Business Intelligence had the highest rating of likely to add value to the club in the future. With all the e-commerce and data security issues, club executives were most forward thinking.

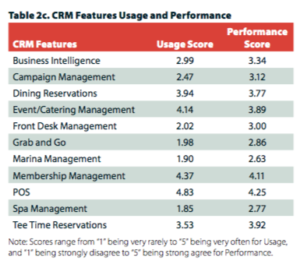
 Usage and Performance. In terms of usage, club executives rated POS as their most used feature at a score of 4.83, which corresponded to the high critical rating. Membership Management, which was ranked second in criticality also ranked second in usage. However, Event/Catering Management came in third overall as opposed to Front Desk. All three features received rating scores greater than 4. As for performance, the most reliable feature club executives agreed to be performing as expected was POS at 4.25 out of 5, followed by Membership Management at 4.11, and Tee Time Reservations at 3.92 (See Table 2c).

 CRM Summary
While the criticality scores reflect the importance of each feature, the usage scores are the true demand level and the performance scores denote the level of demand met. Ideally, the performance scores should be at par or higher than the usage scores, indicating that the features are performing as or higher than expected. In addition, both performance and usage scores should at least mirror the criticality scores, implying that when needed, the features would be present and would perform as expected. As such, the differences or the gaps between the scores are opportunities for improvements.
For all the features in the CRM systems, the biggest gap between criticality (blue) and usage (red) were found in Spa, Marina, and Front Desk Management features. These were acceptable gaps as not all clubs use of these three features. Therefore, while critical, these features might not apply to all clubs. POS, Membership Management, Event/Catering and Dining Reservations had the smallest gap-scores between usage and criticality. Thus, these four features were meeting the demand. Yet the performance scores of all four were slightly lower than the usage, and this is where vendors can contribute value to the clubs to eliminate the gaps.

Accounting
For the accounting system, 11 features 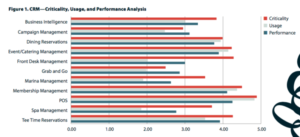 were rated. Alphabetically, the features were: Accounts Payable, Budgeting, Financial Dashboard, Fixed Asset Management, General Ledger, Inventory Management, Membership Management and Accounts Receivable, Online Statements for Members, Payroll and Timekeeping, Purchasing, and Reporting.
Criticality. Of all the features offered in an accounting system, the most critical features were Membership Management and Accounts Receivable (4.94), General Ledger (4.93), and Accounts Payable (4.83) (See Table 3a). This finding should not be a surprise as these three functions affect the entire cash flow of a club and the accuracy and reliability of all accounting work.

Adding Value. When the amount of value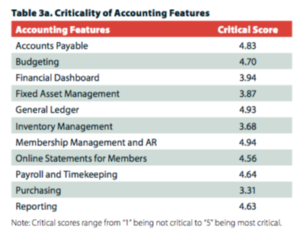 the accounting features added to clubs were tallied, the three features that were rated most critical previously were all rated as the top three in adding value to the club. The one feature that was rated least was Purchasing. With 39 percent of clubs not having this system, and only 4 percent felt it would likely add value to the club in the future, purchasing was rated as the least critical feature. Membership Management and AR was ranked as the feature that helped increase revenues the most, while Payroll and Timekeeping was ranked decidedly as the one feature to help reduce costs (72%—highest rating in the entire study) (See Table 3b). While the General Ledger was seen as the second most critical feature, it was ranked as the least likely to affect costs and revenues. Indeed, the General Ledger is an indispensable financial accounting feature but perhaps not for managerial or cost control purpose. Finally, the feature club executives rated to most likely add value to clubs in the future was Financial Dashboard.
Usage and Performance. As expected, the three most critical features were also the three most used features, in a slightly different order with the General Ledger ranked first, followed by Accounts Payable, and then Membership Management and Accounts Receivable. It was also good to see that these three features also received the highest performance scores in the same order. However, there is a substantial difference, almost half a point in some cases, between the usage score and performance score, indicating that club executives, while satisfied and agree with the performance of the feature as expected, did not give the features the “5” or “strongly agree” rating (See Table 3c).


Accounting Summary
For the 11 features in the accounting systems, the usage scores and criticality scores are very close in eight. And for Financial Dashboard and Fixed Asset Management, the performance scores were higher than the usage scores. Therefore, these two features were performing at a higher score than they were being used. On the other hand, this also showed that the performance scores were not as high as the usage scores in ten features. Though the gaps were not sizable, again, they indicate opportunities for improvement. It might very well be that the features were performing and it was training that might be needed.
Website

In today’s world of social media and the internet, a website is essential for any club to not merely have a virtual presence but also as a tool for communication between a club and its members. Thus, club executives were asked to rate the following seven features related to websites: Email Marketing, Mobile Apps, Networking (wired), Networking (wireless), Online Reservations, Social Media Management, and Website Content Editing.
Criticality. While the criticality scores for the features of CRM and Accounting were in the 4.8 to 4.9 range and as high as 4.94, the highest criticality score for Website was only at 4.46 for Website Content Editing. As the club industry is still very personal in nature, perhaps website technology is seen more as an add- on function instead of a necessity. Nonetheless, Website Content Editing was viewed as the most critical feature, followed by Wireless Networking at 4.33, and Wired Networking at 4.27 (See Table 4a).

Value Added. In terms of adding to or creating value for a club, the two features that were most absent were Social Media Management (27%) and Mobile Apps (26%). Interestingly, club executives also rated the same two features as most likely to add value to their clubs in the future. Email Marketing was seen as highly valuable in increasing revenues, reporting at a high of 67 percent, while Online Reservations was rating as the feature that helped reduce cost the most (24%). Both Wired and Wireless Networking were seen as not affecting revenues and costs, and yet they were ranked second and third of being critical (See Table 4b). Therefore, it is pertinent that the network in clubs has to work properly.

Usage and Performance. Mirroring the value-added scores, Network, both wired and wireless were rated as the top two features in usage and Wired Network also attained the highest performance score. Yet, only two of the performance scores were higher than 4, which was a point of concern and provided room for improvement (See Table 4c).
Website Summary
Of the seven features, all three scores were quite close except Social Media Management and Mobile Apps. It is a good sign that the performance scores of these two features rated higher than the usage score. This signals that the technology is present and functioning, and it may be a matter of time before the criticality usage scores would increase to meet the performance scores.

Security
Finally, given today’s constant security risks, both physical and cyber security pose threats to any business, and clubs are not immune to that. Therefore, four features of security were rated in this study: Access Control, Data Warehousing, Video Analytics, Statistics and Reporting, and Video Surveillance.

Criticality. As seen in Table 5a, Access control to various rooms and space was ranked the highest at 4.41. Similar to website features, security features were also not rated as high in the 4.8 to 4.9 range.
Value Added. As expected and reflected in Table 5b, security features were never expected to help with increasing revenues but rather for safety reasons, and thus perhaps would be rated higher for reducing costs. None of the four features garnered a score of at least 10 percent for helping clubs increased revenues but video surveillance had a score of 40 percent in reducing cost, most probably in deterring theft. Yet, none of the security features was seen likely to add value to the club in the future, with all the ratings at less than 10 percent.

Usage and Performance. With low criticality scores, it could be anticipated that the usage scores and perhaps even the performance scores would be lower (See Table 5c). Indeed, all security features scored the least in usage amongst the four systems, ranging only from a low of 2.42 (Video Analytics, Statistics and Reporting) to the highest at 3.76 (Access Control). The performance scores were also lowest in all the four systems, with the ratings mirroring that of the usage score with Access Control rated the highest at 3.81 and Video Analytics, Statistics and Reporting as the lowest at 3.32.

Security Summary
It is interesting to note that the performance scores of all four features in the security system were rated higher than the usage scores. While this is good news, it also showed that clubs might not be using the existing systems to their fullest potential. Thus, clubs and security system vendors may need to visit to ensure the features were utilized to their maximum capacity.

Next Steps
With all these technologies, one of the set of questions asked in this study was related to the innovativeness of clubs in technology adoption. When asked, in general how hesitant were the participants’ clubs in trying out technology, only 55 percent admitted that they were “not” hesitant—this left us with 45 percent of the clubs that ”would be” hesitant in trying out new technology. And when asked if one’s club was usually the first one to try out new technology, only 20 percent agreed and 5 percent strongly agreed to the statement, a quarter of the participants. Finally, when the degree of willingness to experiment with new technologies was asked, most (31%) stayed neutral, and only 30 percent agreed, and another 7 percent strongly agreed. Technology is something that most are not comfortable with. In clubs, technology adoption is behind other hospitality industries such as hotels. However, technology is essential.
With all findings from the two studies on the systems and features clubs use and the timing of upgrades, how can clubs use this information to their advantage? Is the information only good for club owners and management? What about technology vendors?
First, clubs need to compare their technology profile to the results of the two studies. In other words, if I am a club executive, where does my club stand? Does my club need to upgrade its systems? Where is the lowest hanging fruit? Let’s look at the critical scores as an example. If a certain feature has a high critical score, then does my club have that feature? If so, how often does my club use that feature? How is that feature performing relative to expectations? Also, compare your club’s financials with the industry. For example, are you more concerned with increasing your revenues? If so, look at the features that your counterparts rated as more useful in increasing revenues. Are you more concerned with reducing your costs? Then, take a look at the features that helped reduce costs the most. Tailor the results to the needs of your club.
Second, once your club’s profile is established, look at where your club can improve. Talk to your vendors, read blogs from HFTP or other resources, attend industry webinars (many of them are free, especially those offered by HFTP), or join industry chats regarding new technologies that your club can benefit from. Gather information that can benefit your club.
Then, plan strategically, both short- and long-term. One cannot change everything in one day or even one month. Technology is an expensive proposition and such capital expenses need to be budgeted accordingly. Rank the most important needs of your club and go from there. Plan when such upgrades will be best pursued. Sometimes, it may not simply be a matter of monetary resources but also human resources in terms of training, or even convincing a board that technology can help increase value to the membership.
As for vendors, look at the gaps between criticality, usage, and performance. Sometimes, gaps exist not because of the inferiority of the products but rather the knowledge and training that are needed. The one most obvious example is the two features that are most absent on a website: Social Media Management (26.77%) and Mobile Apps (26.36%). Remember that club executives rated the same two features as most likely to add value to their clubs in the future. Therefore, vendors who have these two functions should visit with their club clients and discuss the positive values of social media management and mobile apps. Work with your club clients and continue to cultivate the business relationship. Sooner or later, a new system is needed, and because of your continuous hard work, your company will be on the top of the list that clubs will place that call. Transactions end; but relationship should keep growing.
Agnes DeFranco, Ed.D., CHAE, and Cristian Morosan, Ph.D., are professors at the Conrad N. Hilton College of Hotel & Restaurant Management at the University of Houston.