Experienced club managers are well acquainted with the metrics on their club’s income statement, and equally familiar with how intensely boards focus on those metrics in their monthly meetings. That focus on the income statement fuels frustrating debates about low-impact issues like the financial results in F&B and, unfortunately, burns time in the boardroom that would be much better spent attending to the health of the club’s balance sheet and financial future. After 10 years of study and analysis, Club Benchmarking research points to focus on the balance sheet and capital ledger as the “secret sauce” common among successful clubs. Just as it does in every industry, the balance sheet reflects the club’s financial health or lack thereof. This article explains three simple balance sheet metrics that together form a “Capital Scorecard” for your club.
Why Focus on the Balance Sheet?
Let’s begin the discussion by defining a few important terms. Clubs often refer to the operating ledger and the capital ledger. The operating ledger is another term for the income statement—also termed the statement of activities. The operating ledger captures the accounting of income and expense related to operating the club, and every club operates for one simple purpose: to provide services and amenities to the members. The capital ledger captures the money associated with capital income and capital investment (obligatory investment for repair and replacement of existing assets, and aspirational investment in growth and expansion of the asset base).
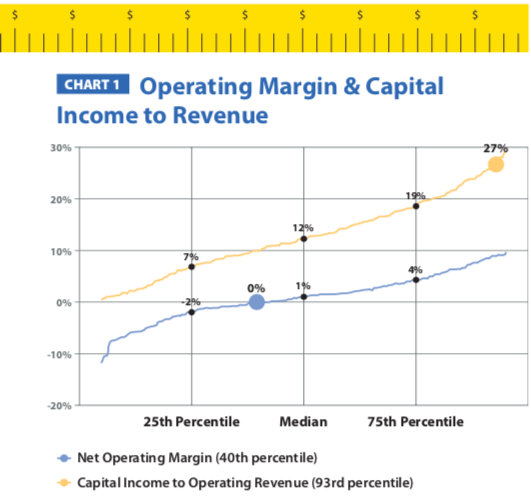
Typically, clubs with 501(c)7 not-for-profit tax status set the income statement at break-even excluding depreciation (which is a capital expense). The income statement is the vehicle for delivering services and amenities to the club’s members—it is not a financial driver. The income statement is “consumed” year-in and year-out by members enjoying the club and is not intended to produce a financial result. This point is proven in Chart 1 (below). As seen by the operating margin (operating result divided by operating revenue) nearly 70 percent of clubs have an operating margin hovering between +/4 percent of revenue. In other words, break-even. A break-even financial outcome, by definition, is not a financial outcome.
Chart 1 below further shows that capital income dwarfs the operating result. The median club shows an operating margin of 1 percent of revenue while generating capital income equal to 12 percent of operating revenue. The subject club (large circles) shows break-even operating margin (0%) with capital income equal to 27 percent of its operating revenue. This is a club we refer to as capital rich. Both the median club and the subject club prove the key point: Capital income is the source of money to drive a club forward financially, and the operating outcome is not a financial driver. This point cannot possibly be overstated.
 The most critical point of learning we have had from the study of more than 1,000 clubs over the last 10 years is understanding the function of the operating ledger (delivering services and amenities to members) and the function of the capital ledger (delivering the money to re-invest in the club.) If you are a club member, a board member or a Finance Committee member considering your club’s financial future, the place to focus is the capital ledger—not the operating ledger.
Growth and Depreciation
The stock market rewards businesses based on real and potential growth. All businesses must grow to survive. The financial growth of a business over time is manifested on the balance sheet as stockholder’s equity. As an example, Amazon’s equity was $450 million in 2006 and $44 billion at the end of 2018—a compounded annual growth of 47 percent. In the club industry, the median club’s equity growth over the same timeframe was 2 percent, barely meeting inflation.
Given the operating ledger is set to break-even excluding depreciation, the way a club grows its equity over time is by generating capital income in excess of depreciation. To be clear, the growth must be as a result of adequate capital income, not due to artificially low depreciation resulting from a lack of historical reinvestment. Clubs generating capital income in excess of the depreciation expense are growing equity and those generating less capital income than depreciation are losing equity.
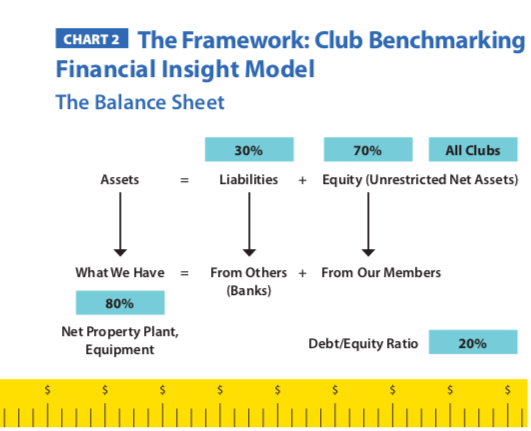
Chart 2 shows the balance sheet of the average club. The balance sheets of private clubs are simple, but not always understood as clearly as they should be. As shown, 80 percent of the average club’s assets end up on a single line item, which is the net book value of Property, Plant & Equipment (PP&E). The other side of the sheet shows that 70 percent of the club’s capital emanates from equity. Considering the break-even nature of the operating ledger, the equity account tallies the total excess of capital contributed above depreciation over the entire history of the club. Money in a club flows from members’ capital contributions into investment in the physical assets of the club.

 Analysis provides clarity regarding the financial cycle in a club: If the club is growing, the cycle over time is positive and if the club is not growing adequately, it is a negative cycle over time. Here are three core concepts related to understanding capital health:
- The operating ledger accounts for the services and amenities enjoyed by the membership. A thriving, growing club is constantly evolving its value proposition by delivering services and amenities in a compelling manner that consistently draws in new members while retaining and satisfying longer term members. The money flowing through the operating ledger (which excludes depreciation) is consumed through the member experience, as it should be.
- Clubs with a compelling value proposition generate capital through initiation fee income and from members who think like owners, not customers, and are willing to contribute the necessary capital through recurring capital dues and/or capital assessments (recurring capital dues being preferable to assessments that come and go). Clubs that view the operating ledger as a financial driver and cut expenses and services (the member experience) typically end up lowering or eliminating the initiation fee to attract new members. Thus, these clubs have less capital to invest as a result. The initiation fee of a club is the best quantitative measure of a club’s value proposition as it reflects the intersection of supply and demand. If it is growing over time, so is demand for the club, and the inverse is true; if the initiation fee is shrinking, so is demand for the club.
- Clubs that generate adequate capital see a growing equity account over time. They have the money necessary to adequately reinvest in PPE and the value of PPE thus grows in conjunction with the equity account. Clubs with an inadequately growing (or shrinking) equity account do not have the necessary capital to adequately re-invest in PPE and as a result see that account shrinking alongside the equity account. They also see their asset base becoming worn, depleted, less relevant and less able to attract and retain members.
A best practice to drive sustainable growth is to assure generation of significant capital income derived from three sources:
- Initiation fees
- Recurring capital dues
- Membership growth (driving more initiation fee income and more capital dues income)
Best practices dictate that club boards allow the management team to manage the operating ledger and the operation of the club while the COO, board and committees work strategically by focusing on the evolution of the value proposition and member experience for current and future members. This structure allows the board to adopt a focus on the capital ledger and balance sheet, which results in a higher probability that the club’s net worth will grow over time since it is capital income that increases net worth
The Capital Scorecard
To quantify a club’s overall capital health, three capital key performance indicators (KPIs) comprise “The Capital Scorecard”:
- Net Available Capital Ratio
2. Net Worth Over Time
3. Net to Gross Property, Plant & Equipment (PPE) Ratio
KPI #1: Net Available Capital
Net Available Capital (NAC) is calculated by adjusting Total Capital Income for the operating result and then subtracting leases. Net Available Capital is essentially earnings before depreciation, but after covering interest on debt.
Net Available Capital is the amount of money left at the end of the year with which the club can do any of the following three things:
- Make capital investment
- Pay down debt
- Build reserves for future capital needs and improvements
When Net Available Capital is measured relative to a club’s total operating revenue as shown in Chart 3, the industry falls into three distinct groups:

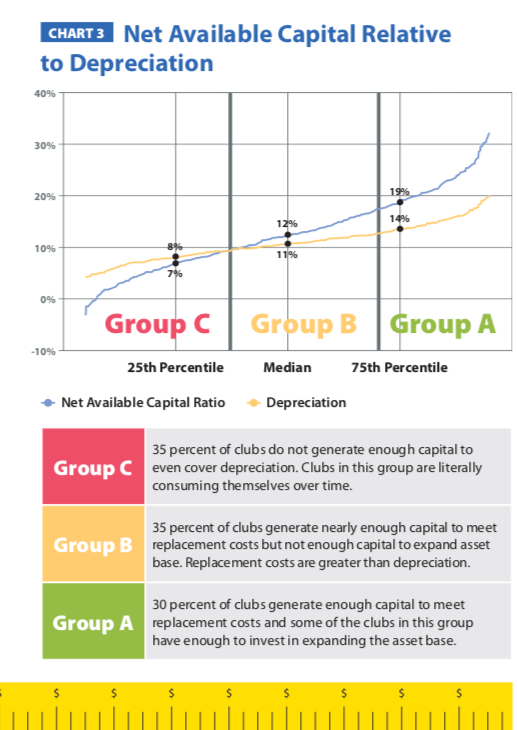 Group A: Clubs with NAC >18 percent (30% of clubs)
These clubs are able to maintain and replace their existing assets and those clubs with higher Net Available Capital ratios are able to build capital for future aspirational improvement projects as well. We refer to these clubs as “capital rich” clubs. Capital rich clubs are the clubs with an initiation fee consistently increasing over time.
Group B: Clubs with NAC equal to or greater than depreciation expense but less than 18 percent (35% of clubs)
These clubs are generating enough capital to replace the assets they are consuming, but future improvement projects will likely need to be funded through assessments and/or debt. Such clubs can/should consider increasing (or instituting) recurring capital dues to generate more capital, allowing for greater aspirational capital investment in the future.
Group C: Clubs with NAC less than depreciation expense (35%
of clubs)
These clubs are “capital starved” and literally consuming themselves. They are not generating enough capital to replace existing assets. If they also have debt to repay, the shortfall is magnified which is obviously a serious situation. The sooner these clubs address the issue, the easier it is to recover. Waiting too long will literally be fatal. Serious change, mainly raising more capital from existing members since these clubs don’t collect substantive initiation fee income, is required to get the ship moving in the right direction.
KPI #2: Net Worth Over Time
As detailed previously, measuring the change in Net Worth (Member’s Equity, Unrestricted Net Assets) Over Time is a mission critical endeavor. This is easily accomplished by charting the year-end equity account since 2006 from your club’s audited financial statements. Starting with 2006 allows you to see how the last economic meltdown affected your club. Club Benchmarking provides this analysis as a free service.
Once the equity over time is charted, the Compound Annual Growth Rate (CAGR) of Net Worth can be calculated. Club Benchmarking’s analysis concludes that clubs must increase net worth by at least 3.5 percent annually to produce adequate capital to maintain the existing asset base. That means the capital income must be greater than the depreciation expense (how much greater varies from one club to the next and can only be precisely defined by commissioning a capital reserve study.) To be clear, the 3.5 percent growth rate will meet the likely obligatory repair and replacement needs but will not be enough for generating future aspirational capital.
As with Net Available Capital, the industry can be divided into three distinct groups for Net Worth Over Time (see chart 4).
Group A: Clubs with >5 percent CAGR (25% of clubs)
These clubs are capital rich clubs where a pattern of continuous reinvestment in facilities and amenities drives higher initiation fees and increased demand for membership in a healthy cycle of growth. These clubs are typically generating adequate amounts of both obligatory and aspirational capital.
Group B: Between 2 – 5 percent CAGR (25% of clubs)
These clubs are typically able to generate obligatory capital but need to turn to debt and/or assessments to fund future aspirational needs. The clubs on the 2 percent end of the ratio are marginally keeping up with capital needs. These clubs should commission a capital reserve study and develop a forward-looking capital plan, including aspirational plans, and then ensure the necessary capital to meet the forward-looking needs is being generated proactively. Clubs that take this path will find themselves in Group A in the future.
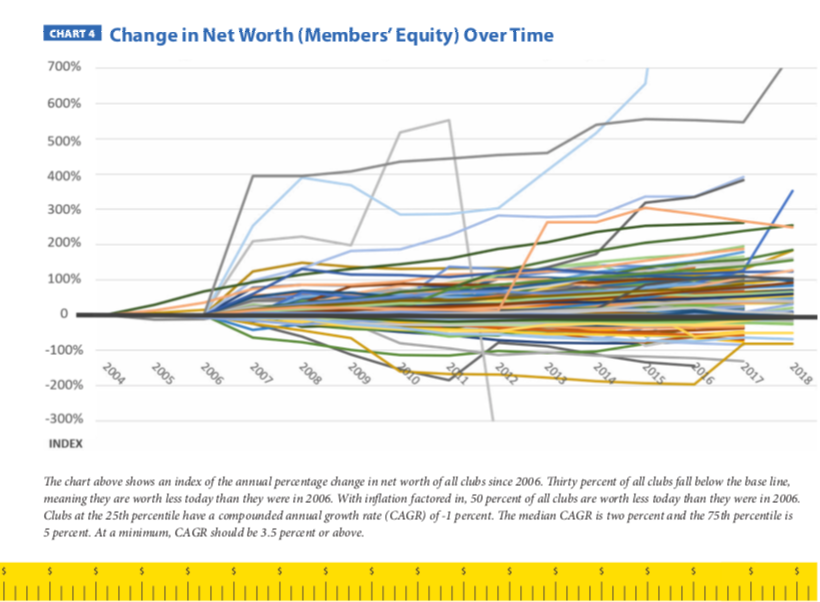 Group C: <2 percent CAGR (50% of clubs)
Depending on where in the range the club falls, the situation can be characterized somewhere between immediate focus required and a full-blown crisis. The clubs with negative net worth over time are in a crisis and need to begin addressing the issue immediately. Ironically, many such clubs are unaware of the situation. The corrective action is consistent with Group B. Changing the future begins with understanding the metrics and the concepts presented in this article and then immediately commissioning a capital reserve study to serve as the foundation for a comprehensive, forward-looking capital plan.
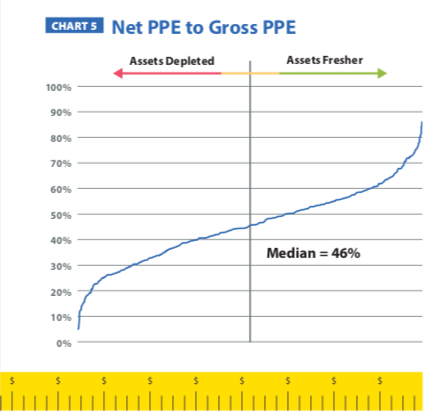
 KPI #3: Net to Gross Property, Plant & Equipment (PPE) Ratio
(Net PPE is simply Gross PPE (excluding non-depreciating land) minus accumulated depreciation. Divide Net PPE by Gross PPE to get your Net to Gross PPE Ratio.)
As explained in Chart 2 (on page 3), 80 percent of the average club’s assets fall on a single line item: Net Property, Plant & Equipment. The Net to Gross PPE Ratio is an indicator of the condition of the club’s physical assets (fresh and attractive or worn and depleted). The Net to Gross PPE Ratio is a simple calculation and it is a critical measure every club leader should know and understand. The higher the ratio, the fresher the club’s assets, and the lower the ratio, the more fully depreciated and worn the assets (see chart 5 on page 6).
As with the other Balance Sheet KPIs, the industry can be divided into three groups:
Group A: Net to Gross PPE Ratio >55 percent (25% of clubs)
Clubs in this group generally have fresh, up-to-date and relevant assets that have been consistently maintained over time.
 Group B: Net to Gross PPE Ratio 46 – 55 percent (25% of clubs)
These clubs are very close to being adequately capitalized with a well-maintained asset base. On the margin, they likely have some deferred needs but nothing dramatic.
Group C: Net to Gross PPE Ratio < 46 percent (50% of clubs)
All of these clubs are showing some wear and tear and have deferred maintenance. The lower the ratio, the more worn and depleted the asset base and the larger the deferred maintenance needs. If your club falls into this bucket, immediate action is required—especially if your ratio is in the 30s or lower.
Calculating your Net to Gross PPE Ratio is a relatively simple way to gain high-level perspective. Ascertaining your club’s specific needs and replacement timeline requires a professional Capital Reserve Study.
Your Capital Scorecard
In combination, these important metrics provide a simple but effective method for evaluating your club’s capital health. Give yourself a letter grade for each of the metrics above based on your own calculations and the categories we provided (A, B, C) to understand how much focus and effort should be placed on your club’s long-range capital planning efforts.
To ensure that every club leader has access to this insight, Club Benchmarking provides a Capital Scorecard Analysis & Report service free of charge. To start the capital scorecard evaluation process for your club, or if you would like to discuss the content of this article, contact Eric Gregory at [email protected] or 626-325-3486.
About the Authors
Eric Gregory, CCM, is executive director at Club Benchmarking. Prior to joining Club Benchmarking to lead the Capital Strategies Modeling service, Gregory had a 20-year career as a club manager and industry educator. He taught Advanced Club Management as an adjunct professor at Cal Poly Pomona. He can be reached at [email protected].
Ray Cronin is founder and chief innovation officer of Club Benchmarking. He has been leading high technology companies for more than 30 years and supporting the club industry with reliable data and proven key performance indicators to analyze, manage and predict performance since 2009. He can be reached at [email protected].